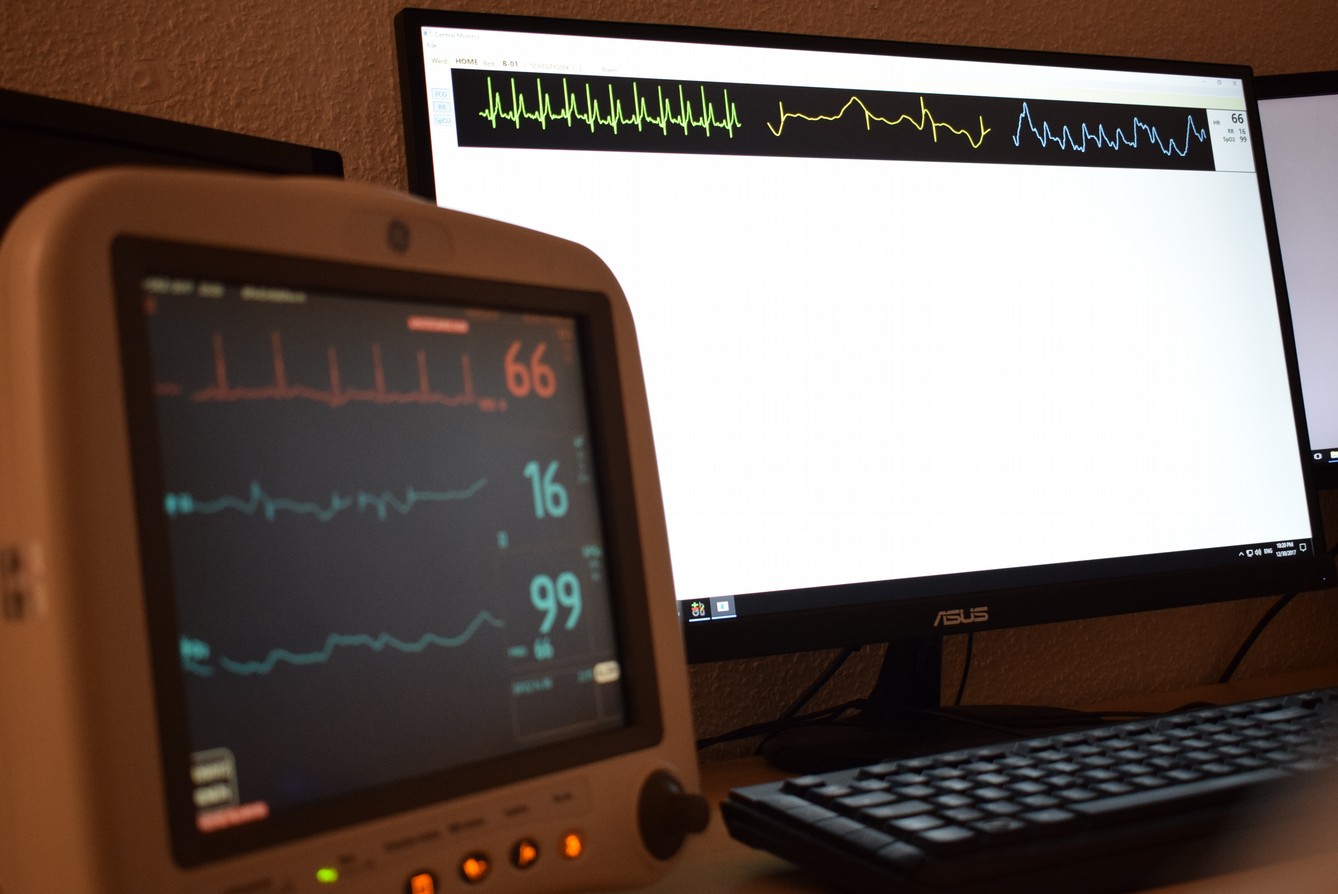
Since my first experiments with ECG circuits I wanted to have one: A professional ECG machine or rather a whole patient monitor (illustrated by one of my early C# projects, available under ”Projects”). Because of my involvement in the First Responder (samarit) activity in the Red Cross and my overall interest in traumatology, I have been looking for a mobile monitoring system. The holy grail is a Lifepak, which is both a monitor and an AED/defibrilator. Used, and with all features, I could have bought a Lifepak 12 for approx. 12.000 DKK (including shipment). That’s pretty affordable for such a machine. But it’s still expensive given that I’m not going to use it for anything significant, other than monitoring myself. I’m interested in monitoring my sleep habits and to understand why I’m so tired when waking up. Sleep isn’t currently something I thoroughly enjoy.
Instead of a Lifepak, I have found a stationary patient monitor (still with batteries, if I should ever have the desired to take it somewhere) for the price of approx. 3.000 DKK. A GE Dash 4000. Still an expensive project, but way more affordable than the Lifepak and with the same monitoring options (if not more).
My new monitor has a 5-lead ECG, SpO2 and non-invasive blood pressure cables and sensors for temperature, 12-lead ECG and invasive blood pressure are available (invasive blood pressure is a feautre I will never use, because it is what the name suggests: A probe inserted in the body some some kind of puncture of either the skull (pressure of the brain cavity) or a blood vessel).
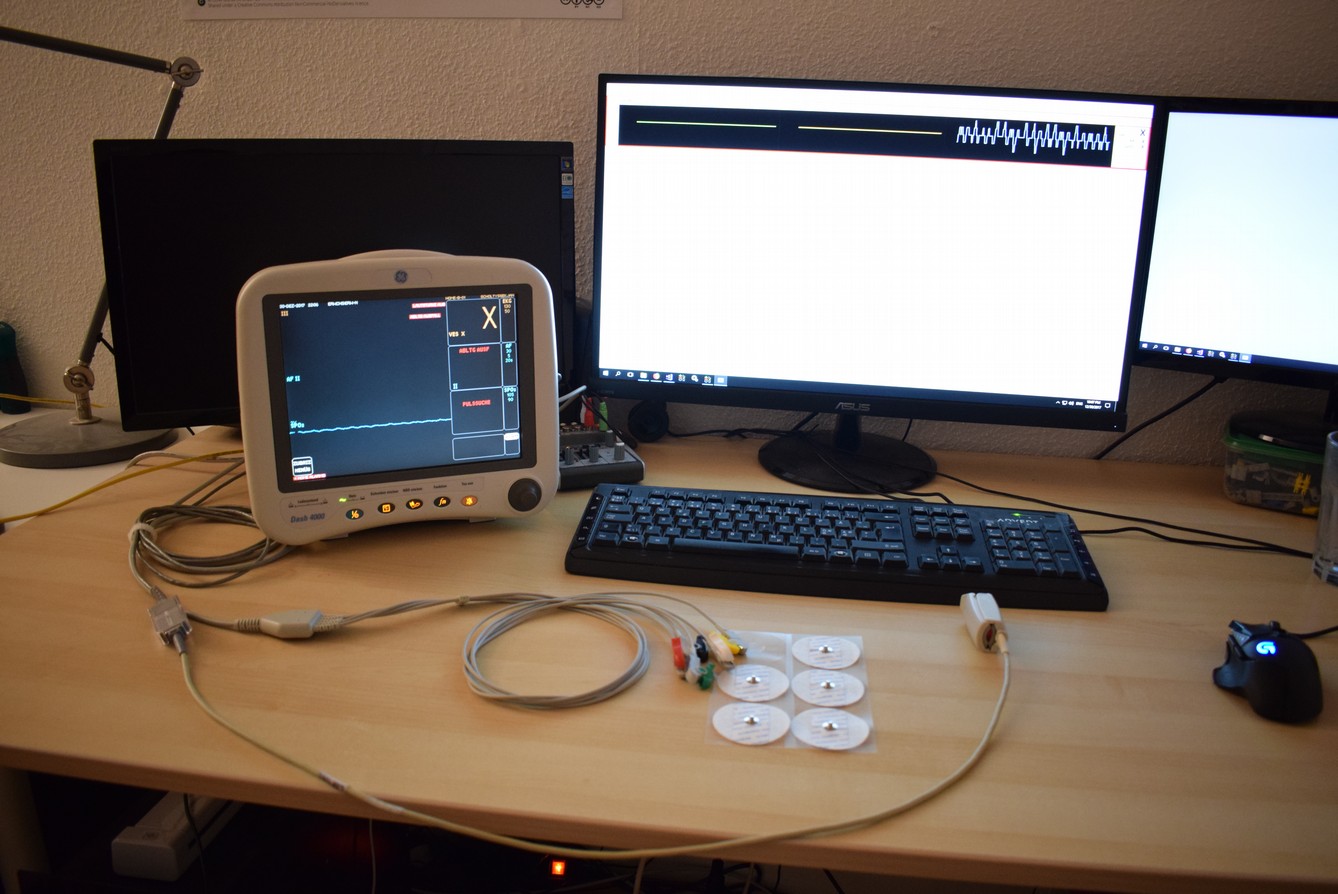 In order to use the monitor for monitoring over longer time spans and in order to be able to store the data, I needed to get the data out of the monitor and other to a PC. For a moment I thought: ”There must be an API for this”. Then I realized that this isn’t some component for others to build into their own systems, but a system used for intensive care of (potentially) very sick people. From the manual I knew that there is a software (or rather pre-installed computer) which is sold by GE for monitoring a whole ward. Hence my project became to figure out how the protocol works. This is what I will describe in the rest of this blog. The result is the software you see on my PC screen. I’m now able to get the data from the monitor and store it and visualize it, including alarms.
I started by monitoring the network traffic from the monitor using Wireshark. What I saw was this:
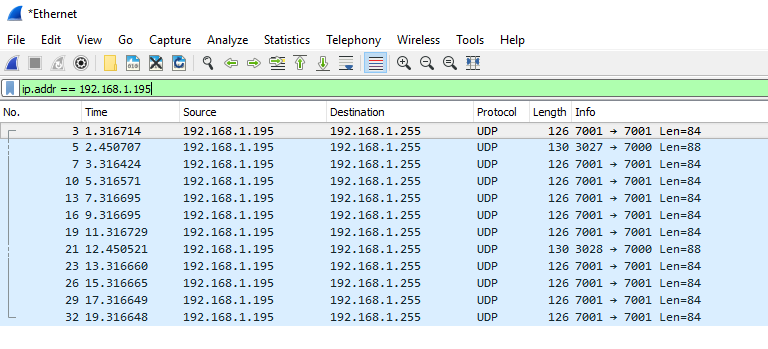 The 192.168.1.195 IP-address is the monitor, 192.168.1.255 is a broadcast address, which leads to all devices with an 192.168.1.X IP-address to receive the packages. From the ”Info” column we also see that data is sent to port 7000 and 7001. A typical message to port 7000 looks like this:
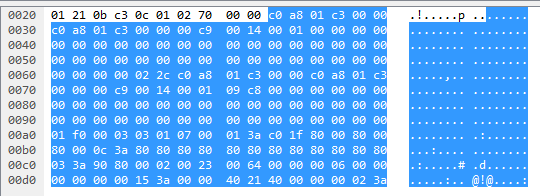
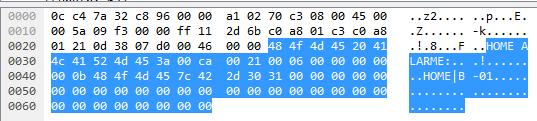
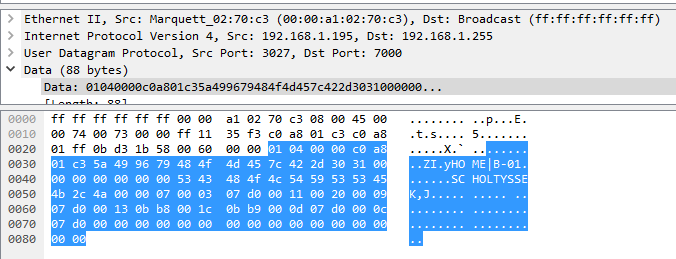 This shows all the data transmitted. The top half of the image contains network transmission information (like source and target IP-addresses) and the lower half is the data including payload (the selected part). The payload is what is of interest. I will walk you through my thought processes: First I noted the ”HOME|B-01” and the ”SCHOLTYSSEK,J” parts, which are settings I had set up on the monitor, being the ward name (HOME), bed name ”B-01” and the patient info. The bytes between these two sections is a series of 0x00-bytes (i.e. all bits are zero). Then I noted the ”c0 a8 01 c3” part (starting in the first row of the selected data). ”c0” is hexadecimal for 192, ”a8” for 168 and so on, which is the IP-address of the monitor. All the other bytes couldn’t be identified from this information. By comparing multiple messages, I figured out that the bytes directly after the IP-address are a counter, i.e. ”5a 49 96 79”, which in the next message was ”5a 49 96 83”, which is an increase of 10. Noting that these messages are sent every 10 seconds, this probably means it is some sort of timestamp.
Moving on to the message sent to port 7001:
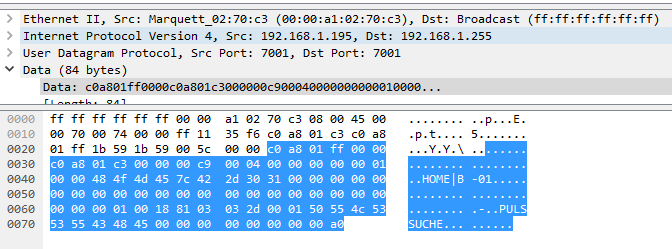 The first things to note are the ”HOME|B-01” part and the ”PULSSUCHE” part (my monitor is with German language). The ”HOME|B-01” part is as in the first message the ward and bed name. The ”PULSSUCHE” part is a description of an alarm cause, indicating that this is some kind of alarm message. This is also sent every 2 seconds, underlining the higher importance. The first bytes of the payload (the selected part) is again an IP-address, this time the broadcast address first and, seperated by two zero-bytes (0x00) the address of the monitor. We note the many zero-bytes, which makes it easier to see the significant data. By comparing several messages, also after restarting the connection, I noticed that the last bytes (probably the last 4) are a timer, which reset for new alarms, i.e. it starts with 0 and increments by 2 for every 2 seconds, hence the elapsed time since the alarm occurred. All other bytes contain unknown information for now.
For one day I tried to get the monitor to output the waveform data by sending these messages back to the monitor, both raw and by exchanging the IP-address bytes, but without any new data from the monitor. An intensive port scan using nmap (a program for looking for open ports/available services on computers) reveiled that no TCP ports are open, while UDP ports with the number 7, 37, 2000, 3000, 3001, 3002, 30003, 7000, 7001 and 8000 are open (or rather not competely blocked). Sending data to these ports didn’t result in further reactions by the monitor. My thoughts at that stage were that I would need to get access to a central monitoring station (called CIC Pro Center) in order to get a working data connection with waveform data from the monitor. The CIC Pro Center contains software which can discover and monitor all GE patient monitors on the same network as the machine, hence it would also be able to communicate with my monitor and I would be able to listen to that communication using Wireshark. On ebay I could have ordered a CIC Pro Center from the United States for 2.000 DKK + shipping, which for a moment seemed like my only option.
My dad reminded me to give it more time, so I did and it paid off pretty quickly. Before going to bed that night (at 3 AM) I remembered that the monitor had options for seeing alarms and waveforms from other beds, which would mean it is capable of initiating a data connection with waveform data. From there on it was labourious but straight forward to decode the communication necessary for obtaining the waveform data.
I started by sending discovery message (those messages sent to port 7000) for a fake bed ”B-02” and patient ”SCHILDISSEK, J” (referring to my nickname Schildi, given in my high school years). This worked beautifully, as I was able to see a new bed when listing other beds on the monitor. When selecting that bed, new messages were sent on the network to port 2000 to the IP-address of my PC (which was sending the fake discovery messages). Messages were sent to port 2000 from two different ports once every second from the monitor:
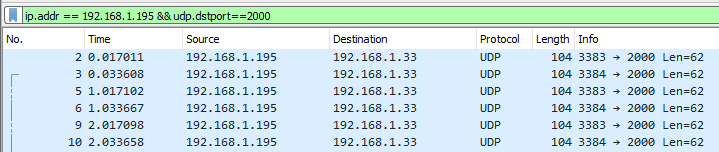
The source ports (as well as the port for the discovery message) changes, incrementing by one for each discovery message, being some kind of conflict resolution technique (i.e. the handling of two monitors trying to use the same ports, which usually leads to ambiguous data and network resources being used multiple times resulting in data collisions). The message sent by the lower port looks like this:
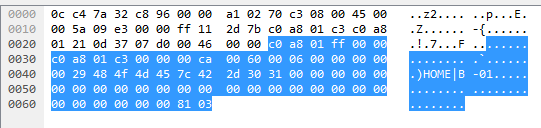
Again we notice the ”HOME|B-01” part and the IP-addresses in the first few bytes. Comparing multiple messages didn’t reveil any counters, but then the message changed to look like this:
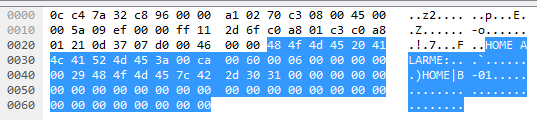
Notice that the start of the data is different, now containing a text ”HOME ALARME:” which is the same message promted at the bottom of the screen of the monitor. The other bytes didn’t make sense to me, but I noticed that the 0x29 (second byte and 3rd row), just before the bytes for ”HOME|B-01” was constant in all messages.
Moving on to the message from the second port: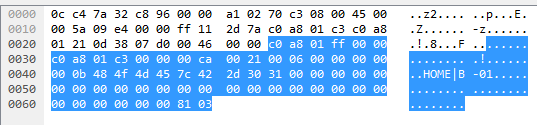 Which looks very similar, with only a few bytes changed. Most noticably the byte immediately before the bytes for ”HOME|B-01”, which now is 0x0b instead of 0x29. Similar to the change in message content for the message from the first port, the second port has the same change:
 We now know how messages look for initiating data transfer from a monitor!
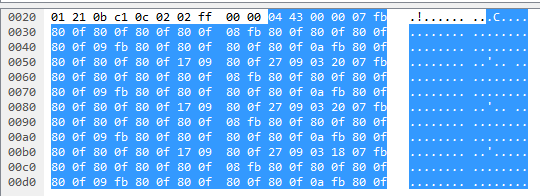
After writing a message generator, which would fill in the IP-address of my PC and a fake bed name ”B-02” and leaving all other bytes unchanged, I started sending these messages back to the monitor and to my joy got a response back. Starting with the response to the message sent by the SECOND port (because these responses are sent at a much higher rate, 4 per second):
 (truncated, total message length is 759 bytes)
This time there is no clear text to guide us, instead we can notice that the bytes are in a pretty regular pattern: 0x80 0x0f (or just 80 0f), interrupted by some other sections. Because of the amount of data, its frequency and the regular pattern, I guessed that this must be the waveform data (or at least hoped for it). Because the bytes repeat for every 2 bytes, I guessed that the data is transmitted as 16-bit values, known as ”short”, ”Int16” or the unsigned versions ”ushort”/”UInt16”. The bytes not matching the 80 0f pattern also had a length of typically 2 bytes and less often 6 bytes. One example is ”17 09”, translated to a ushort is 5897. The rest of the analysis is easiest done by looking at the bytes converted to a list of ushorts (corresponding byte pair in parenteses):
- 1091 (04 43)
- 0 (00 00)
- 2043 (07 fb)
- (4 times 32783 = 80 0f)
- 2299 (08 fb)
- (4 times 32783)
- 2555 (09 fb)
- (4 times 32783)
- 2811 (0a fb)
- (4 times 32783)
- 5897 (17 09)
- 32783 (80 0f)
- 9993 (27 09)
- 800 (03 20)
- (Repeating of 3.-14.)
After detecting this pattern, I made the following conclusions:
- The first two values (corresponding to the first 4 bytes) are some kind of header, which I later, by comparing several messages verified. In fact this is a sequence number, making it easy to spot when messages were lost.
- The common value ”32783 (80 0f)” is the actual waveform data, but for now indicating invalid data, because none of the sensors were connected at that time. To confirm this I would have to connect the sensors and observe that these values change. I later verified this.
- The values just before the actual waveform data must be some kind of sensor ID.
- Observe that the byte value of the first 4 sensor IDs is ”07 fb”, ”08 fb”, ”09 fb” and ”0a fb”, which looks suspiciously like 4 variants of the same sensor, which could only be the ECG leads. The fact that these sensors are followed by 4 waveform values means a higher data rate, which makes sense for ECG data.
- Observe that there are two more sensors, one of which has a waveform value different from all other sensors, namely a waveform value of 800. The only sensor at that time showing a valid line on the monitor was the SpO2 sensor, which hence must correspond to the sensor ID 9993 (27 09). The other sensor 5897 (17 09) later, when connecting the sensors, showed to be the respiration, i.e. the rise and fall of the chest.
By concatenating the data for each sensor and the stream of packages, I got my first result:
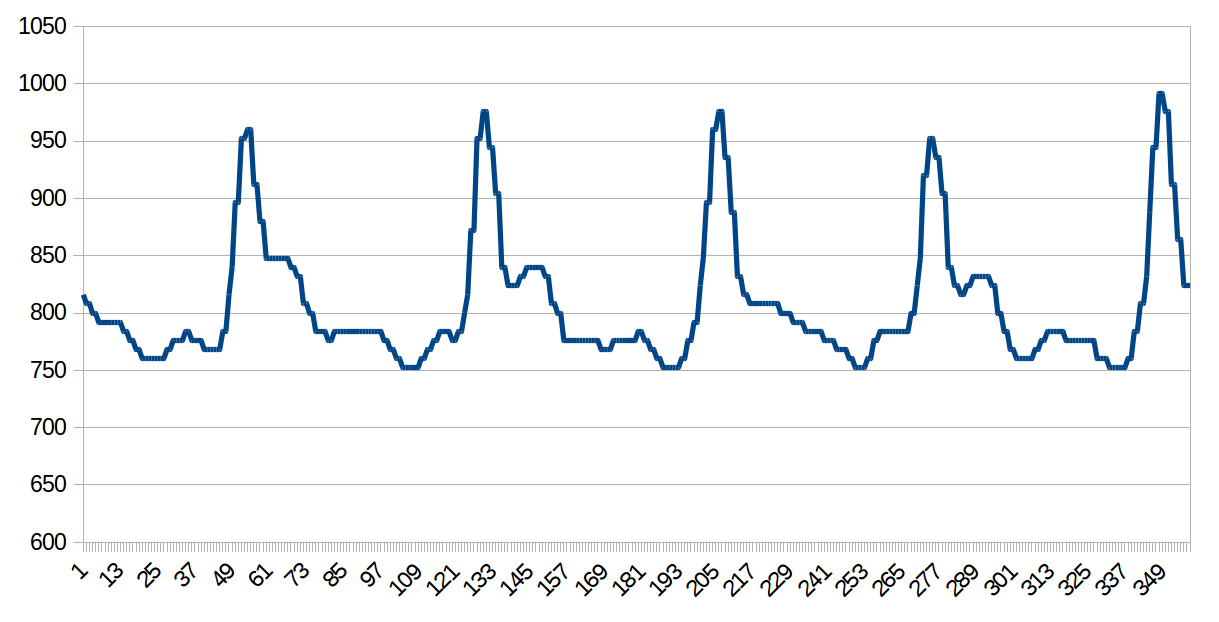 This is a beautiful Pleth-graph, i.e. the signal of the oxygen saturation measuring sensor SpO2.
The ECG data wasn’t that great though: 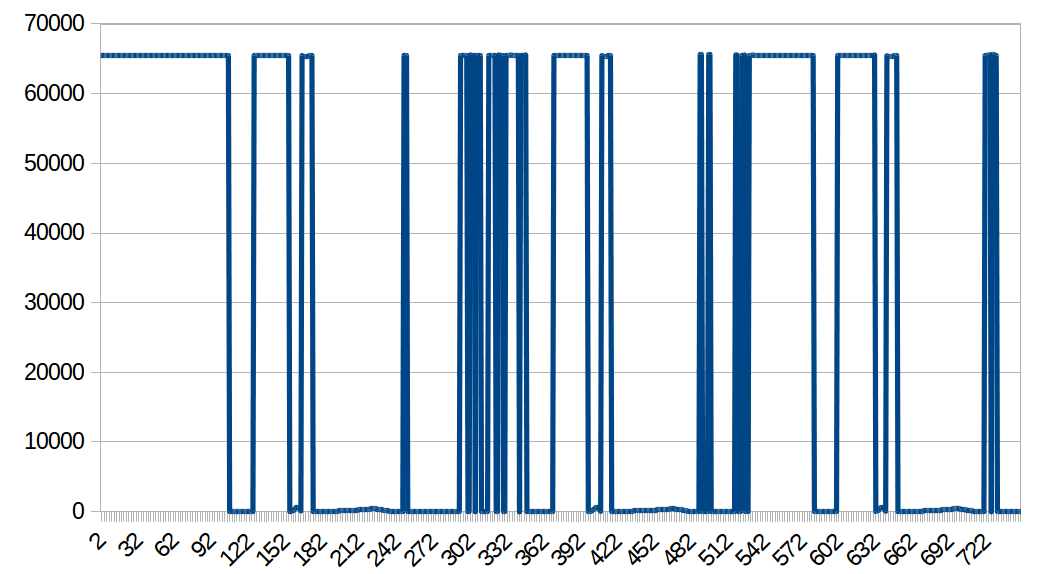 Zooming in on the interval -100 to 500:
 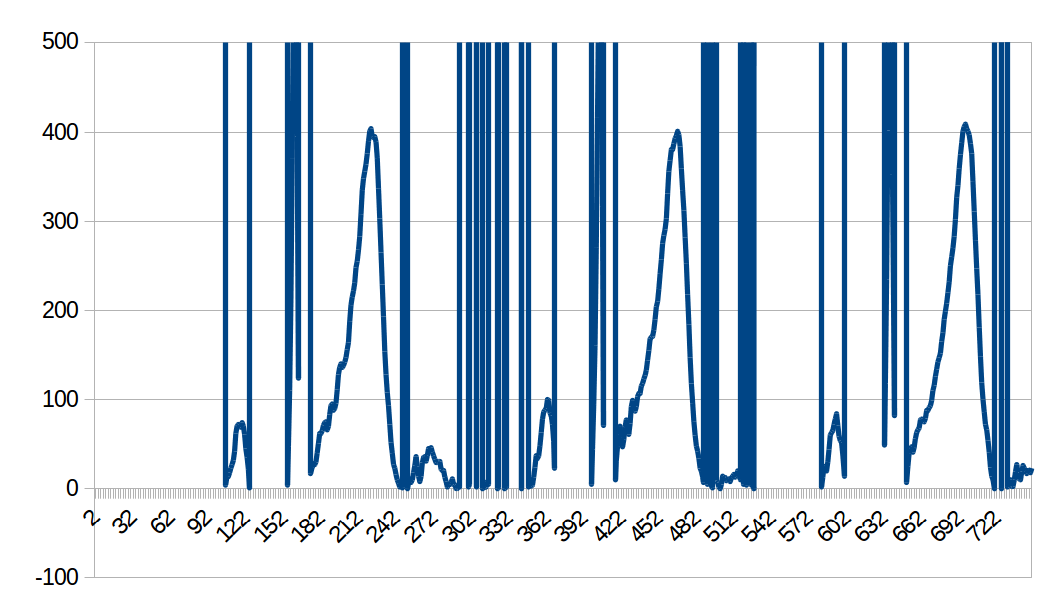 We see some nice spikes, which look like those from an ECG, but there is this data which gives ridiculous values. Because this happens always when I would expect the data to become negative, I figured out that I must detect decode negative data in a different way. Zooming in on the high values reveiled that the waveform continued there. Looking at the byte representation I saw that values, which should have been -1 were ff fe, -2 was ff fd, -3 was ff fc and so on, showing that negative values were identifyable by high values. I hence received at an algorithm for converting ushorts to shorts which was:
If value below 0x8000 return value, else return -(0xffff-value)
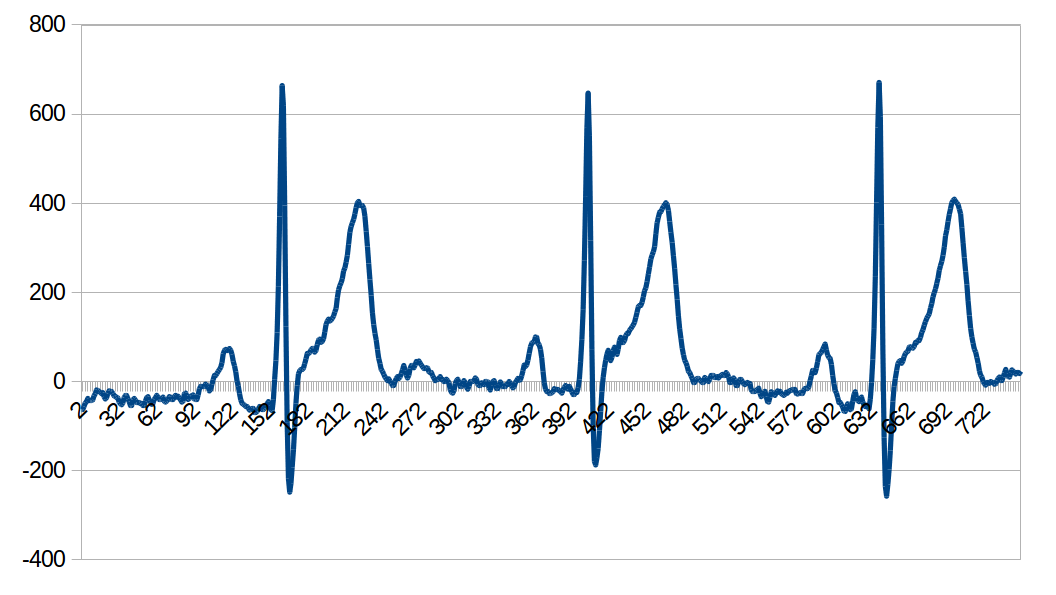
This resulted in a nice ECG:
 A last note to the package with the waveform data: The data contains a tail, with many zero-bytes and a few constant bytes, which I haven’t found the meaning of, but seems to be some kind of control data, not strictly necessary as long as the data is transfered without errors.
Finally we look at the message sent to the FIRST port of the data request.
Because we have not found any information on the measured values like heart rate, blood pressure nor oxygen saturation, I expected to find these information in this message. The start of the message looks like this:
 This message is only sent every 2 seconds, instead of the 250 ms of the waveform data, supporting the suspicion that this contains the measurements, which are only updated so often.
The first bytes are again recognized as IP-addresses. For some reason included twice. Moving further down, at byte 60, we again meet the IP-address of the monitor, twice.
The decoding of this message was way more complicated than that of the previous ones.
First I compared several messages and found that byte 76 and the next 4 bytes were a counter, which would change for each message. I also noted that the last byte of this counter was repeated several times in the message with a separation of 70 bytes, indicating sections of length 70.
I used a technique where I took a full overview of the bytes and marked repetitious bytes and other patterns.
 The overall structure seemed to be:
- IP-address section 1
- IP-address section 2 (containing the counter bytes)
- Some section which had a high similarity with all the following sections, but was prefixed with 4 additional bytes and didn’t start with a repetition of the last counter byte.
- Several sections of length 70
- A final repetition of the last counter byte and a zero-byte.
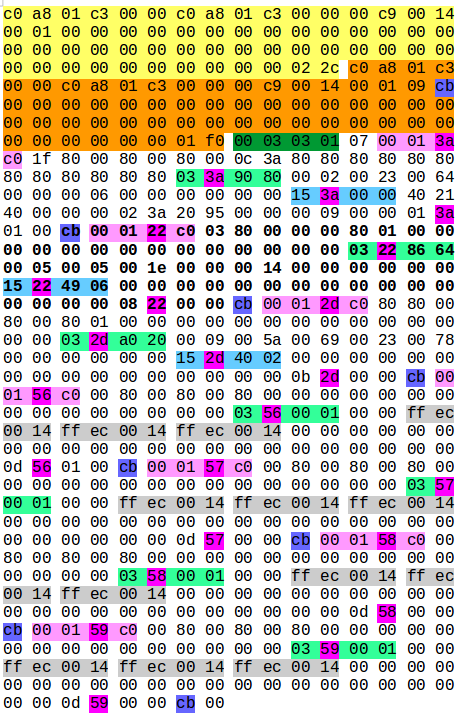
One of the sections is repeated here: 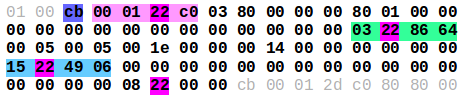
The section starts with the last counter byte (in this case ”cb”). The next 4 bytes have the pattern ”00 01 XX c0” where XX is a value that is repeated several times in that section. Combined with the fact that this value increases by one for 4 sequential sections, namely 56. 57. 58 and 59, makes it very likely to be a sensor ID, with 56-59 being the 4 ECG leads.
By connecting the sensors and monitoring for changing values in this message, I was able to identify the sensors as follows:
- 3a: ECG – heartrate and VES (ventricular extra systoles)
- 22: Respiration
- 2d: SpO2
- 18 (not shown in this message): Blood pressure
- 56, 57, 58, 59: ECG – ST-elevation
After identifying the sensors I iteratively identified the bytes. The sixth byte of the section is indicating whether the sensor is connected, faulty or in some other kind of state. For ECG ”1f” means the cable is disconnected, while ”08” means the sensor is working properly.
The next bytes are combined in pairs to a ushort value, being the actual measurements. Byte 32 and on contain the alarm limits, which I most prominently saw from the ECG lead sections, where ”ff ec 00 14” translates into ”-20, 20”, which is the lower and upper limit of ST-elevation in units of 0.1 mm. Some sections contain subsections with the pattern ”03 XX yy yy” where XX is the sensor ID and yy yy is a sensor specific value for the sensor configuration, e.g. the lead used for measuring respiration or the quality of the SpO2 measurement. I figured this out later in the process when I started simulating these messages and sending them back to the monitor for visualization. When setting yy yy to 00 00, the data was rejected. When using a copy of the bytes received from a working sensor, I noticed that the quality indication of the SpO2 measurement was shown. When recording more data from the real sensors, I noticed that these yy yy-bytes changed when the quality indicator changed.
Then there is the ”15 XX yy yy” subsection which I haven’t decoded yet, but works fine with a copy of the bytes from a working sensor.
Finally the section is closed by a pattern ”ZZ XX 00 00”, where XX is the sensor ID and ZZ changes for different sensor types. I think this is some kind of priority or order indicator.
After decoding these messages by looking at recorded data an sending simulated data to the monitor, looking for rejected data (in which case nothing is shown on the screen), I was confident that I had decoded the most essential parts. Until I activated the blood pressure sensor to my simulated data. Then my data got rejected.
I had made an exact copy of a working blood pressure section and hence ruled this out as the cause. The other sensor sections were unchanged as well. I hence figured that the problem must be with the IP-sections or the 4 bytes prefixed the sensor sections. By removing the blood pressure sensor from my simulated data, the data was shown on the monitor once again. After verifying that I’m in a working state, I changed the last bytes in each IP-section to 00 00. This resulted in the data being rejected/not shown, underlining the importance of these bytes. I noticed (don’t ask how) that the difference of the last bytes in section 1 and section 2 was exactly the length of one IP-section:
0x022c – 0x01f0 = 0x3C = 60
Furthermore 0x022c = 556, plus the length of the IP-section of 60, summing to 616 and a total data length of 616, I had the answer: The last bytes in each IP-section are message lengths.
A last piece of the puzzle is yet missing: The five bytes after the IP sections. I’m not completely sure of their meaning, but I’m pretty sure that the fifth byte is the number of sensor sections following.
When re-adding the blood pressure sensor to my simulated data and modifying the IP sections, the data was correctly shown.
With decoding and simulation fully up and running it was time for the last part (for now) of this project: A GUI.
I wanted to be able to see the waveforms live on the screen. This is plain WPF/C#/.NET programming and I will not go into any details. For the plotting of the waveforms I had to experiment with three different solutions. First I tried LiveCharts, but the performance on updating 3 charts with 10 Hz used up all CPU resources. I temporarily tried to implement my own chart using a canvas and lines. This worked fine but was inflexible with regard to axis scaling and so on. I then tried OxyPlot, which works fine for me and with few lines of code.
The source code for the project is on github: https://github.com/mindleaving/gedash
Bravo Jan,Absolutely great!