Illustration for “Machine learning response” post
Code & data download: MachineLearningResponseTest.zip
Can the result of machine learning techniques be trusted? Do they find the underlying pattern? What do the results look like if there is no pattern?
These are my notes for experiments with different machine learning techniques, which I tested with different data sets.
The datasets:
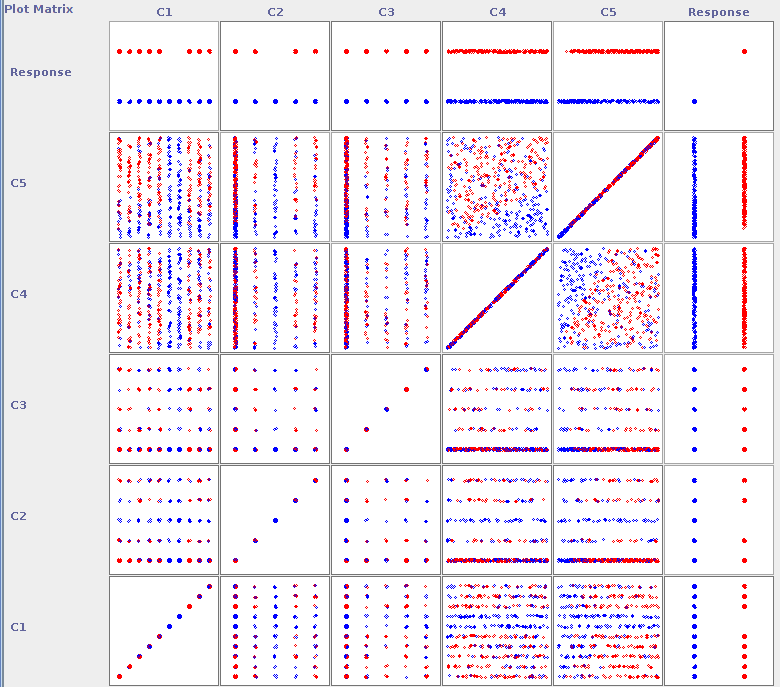
The dataset contains 1000 entries with 5 feature-columns and 1 response column.
Feature data: The feature columns contain random data of the following characteristics:
- C1: Integer between 1 and 10
- C2 & C3: Integer between 0 (50%) and 4 (1-4, 50%)
- C4 & C5: Real number between 0 and 3, uniform distribution
Noise response: The response was generated randomly with 50% probability of “0” and “1”, respectively.
Known pattern response: This dataset is generated by designing a simple decision tree and generating the response.
The MATLAB code for generating similar data is in the zip-file, found at the top of this post.
Method:
The datasets generated above were loaded into Weka (Weka project website), a machine learning suite, allowing for fast data exploration and testing of different machine learning algorithms.
The noise dataset was passed to several supervised classifiers. For evaluation 3 options were chosen: 1) Training and testing on the full dataset, 2) training with 10-fold cross validation, i.e. split the training data into 10 sets of equal size and leave one out in every iteration for testing, and 3) training on the first 80% and testing on the last 20%.
These algorithms were tested: SVM, AdaBoost, Simple CART, Logistic regression, Naive Bayes, Bagging.
The default parameters were used. The correct classification rate was used as the evaluation measure. The closer this number is to 100%, the better. The worst performance should be approximately 50%, which corresponds to random guessing.
Noise Response:
The expected result for the noise data was, that all algorithms would have a success rate of approximately 50%, i.e. the result of random guessing.
When using the full data for both training and performance evaluation, the correct classification rate was:
- SVM: 57.2%
- AdaBoost (with decision stump classifiers): 56.8%
- Simple CART: 52.8%
- Logistic regression: 56.7%
- Naive Bayes: 58.4%
- Bagging (with REP tree classifiers): 77.3%
When using the same data for testing and training, we must expect overfitting, i.e. the model captures too many random variations present in the training data and embeds them in the model. If the model is just complex enough, we would be able to get 100% correct classification when using the training data for testing. It surprised me, that the models didn’t perform better on the training data. Only Bagging (with REP tree classifiers) got a high rate of correct classification, suggesting that this model might have a tendency to overfitting.
Next the performance on a split dataset was tested, where 80% (=800 samples) were used for training and 20% for testing. The performance was:
- SVM: 52.5%
- AdaBoost (with decision stump classifiers): 53%
- Simple CART: 48%
- Logistic regression: 54%
- Naive Bayes: 49.5%
- Bagging (with REP tree classifiers): 48.5%
The lesson to learn from these numbers is, how large variations we have to expect if there is no underlying pattern to be found. All algorithms have a performance close to 50%, as expected. The variation is in the order of 5%, which means, that classification results of up to 55% might still indicated (and should be treated as such) as if there is no pattern found. This number is dependent on the sample size, which in our case is 1000. The more samples, the less deviation from 50% is expected for a random response.
Known pattern response:
For the data with known response, the results for training and testing on the full data were:
- SVM: 94.5%
- AdaBoost (with decision stump classifiers): 84.4%
- Simple CART: 99.3%
- Logistic regression: 93.1%
- Naive Bayes: 90.5%
- Bagging (with REP tree classifiers): 96.4%
For the split data (split 80% training, 20% testing) the results were:
- SVM: 94.5%
- AdaBoost (with decision stump classifiers): 85.5%
- Simple CART: 94.5%
- Logistic regression: 88%
- Naive Bayes: 91%
- Bagging (with REP tree classifiers): 88.5%
All models have a high performance, though none achieves 100% correct classification on neither full-data training-testing nor split data. The models found by Weka suggest that most models, especially rule based models, like Simple CART, AdaBoost and Bagging, struggle with the rule “C4 > 2*C5” used in the response generation. Since these method can only split data along one dimension at a time, i.e. cut feature space into boxes, they cannot fully model this pattern with the limited depth and branch pruning set in the default parameters.
Bagging has the largest gap between full data and split data performance, again pointing towards a higher tendency of overfitting of local variations compared to the other methods.
Comments are closed.